// Quarri for Manufacturing & Distribution

Manufacturing & distribution, perfected.

Cut downtime. Optimise input and output inventory. Live lead times. From plant floor to dispatched truck on one operating layer - on the systems you already run.

// In
  • Maintenance logs & shift reports
  • Supplier invoices & GRNs
  • ERP · MES · SCADA data
  • Workforce & rota systems
// Out
  • Live throughput & downtime
  • Defect alerts (line, shift, batch)
  • Inventory turn & lead time
  • Margin clarity (category → SKU)
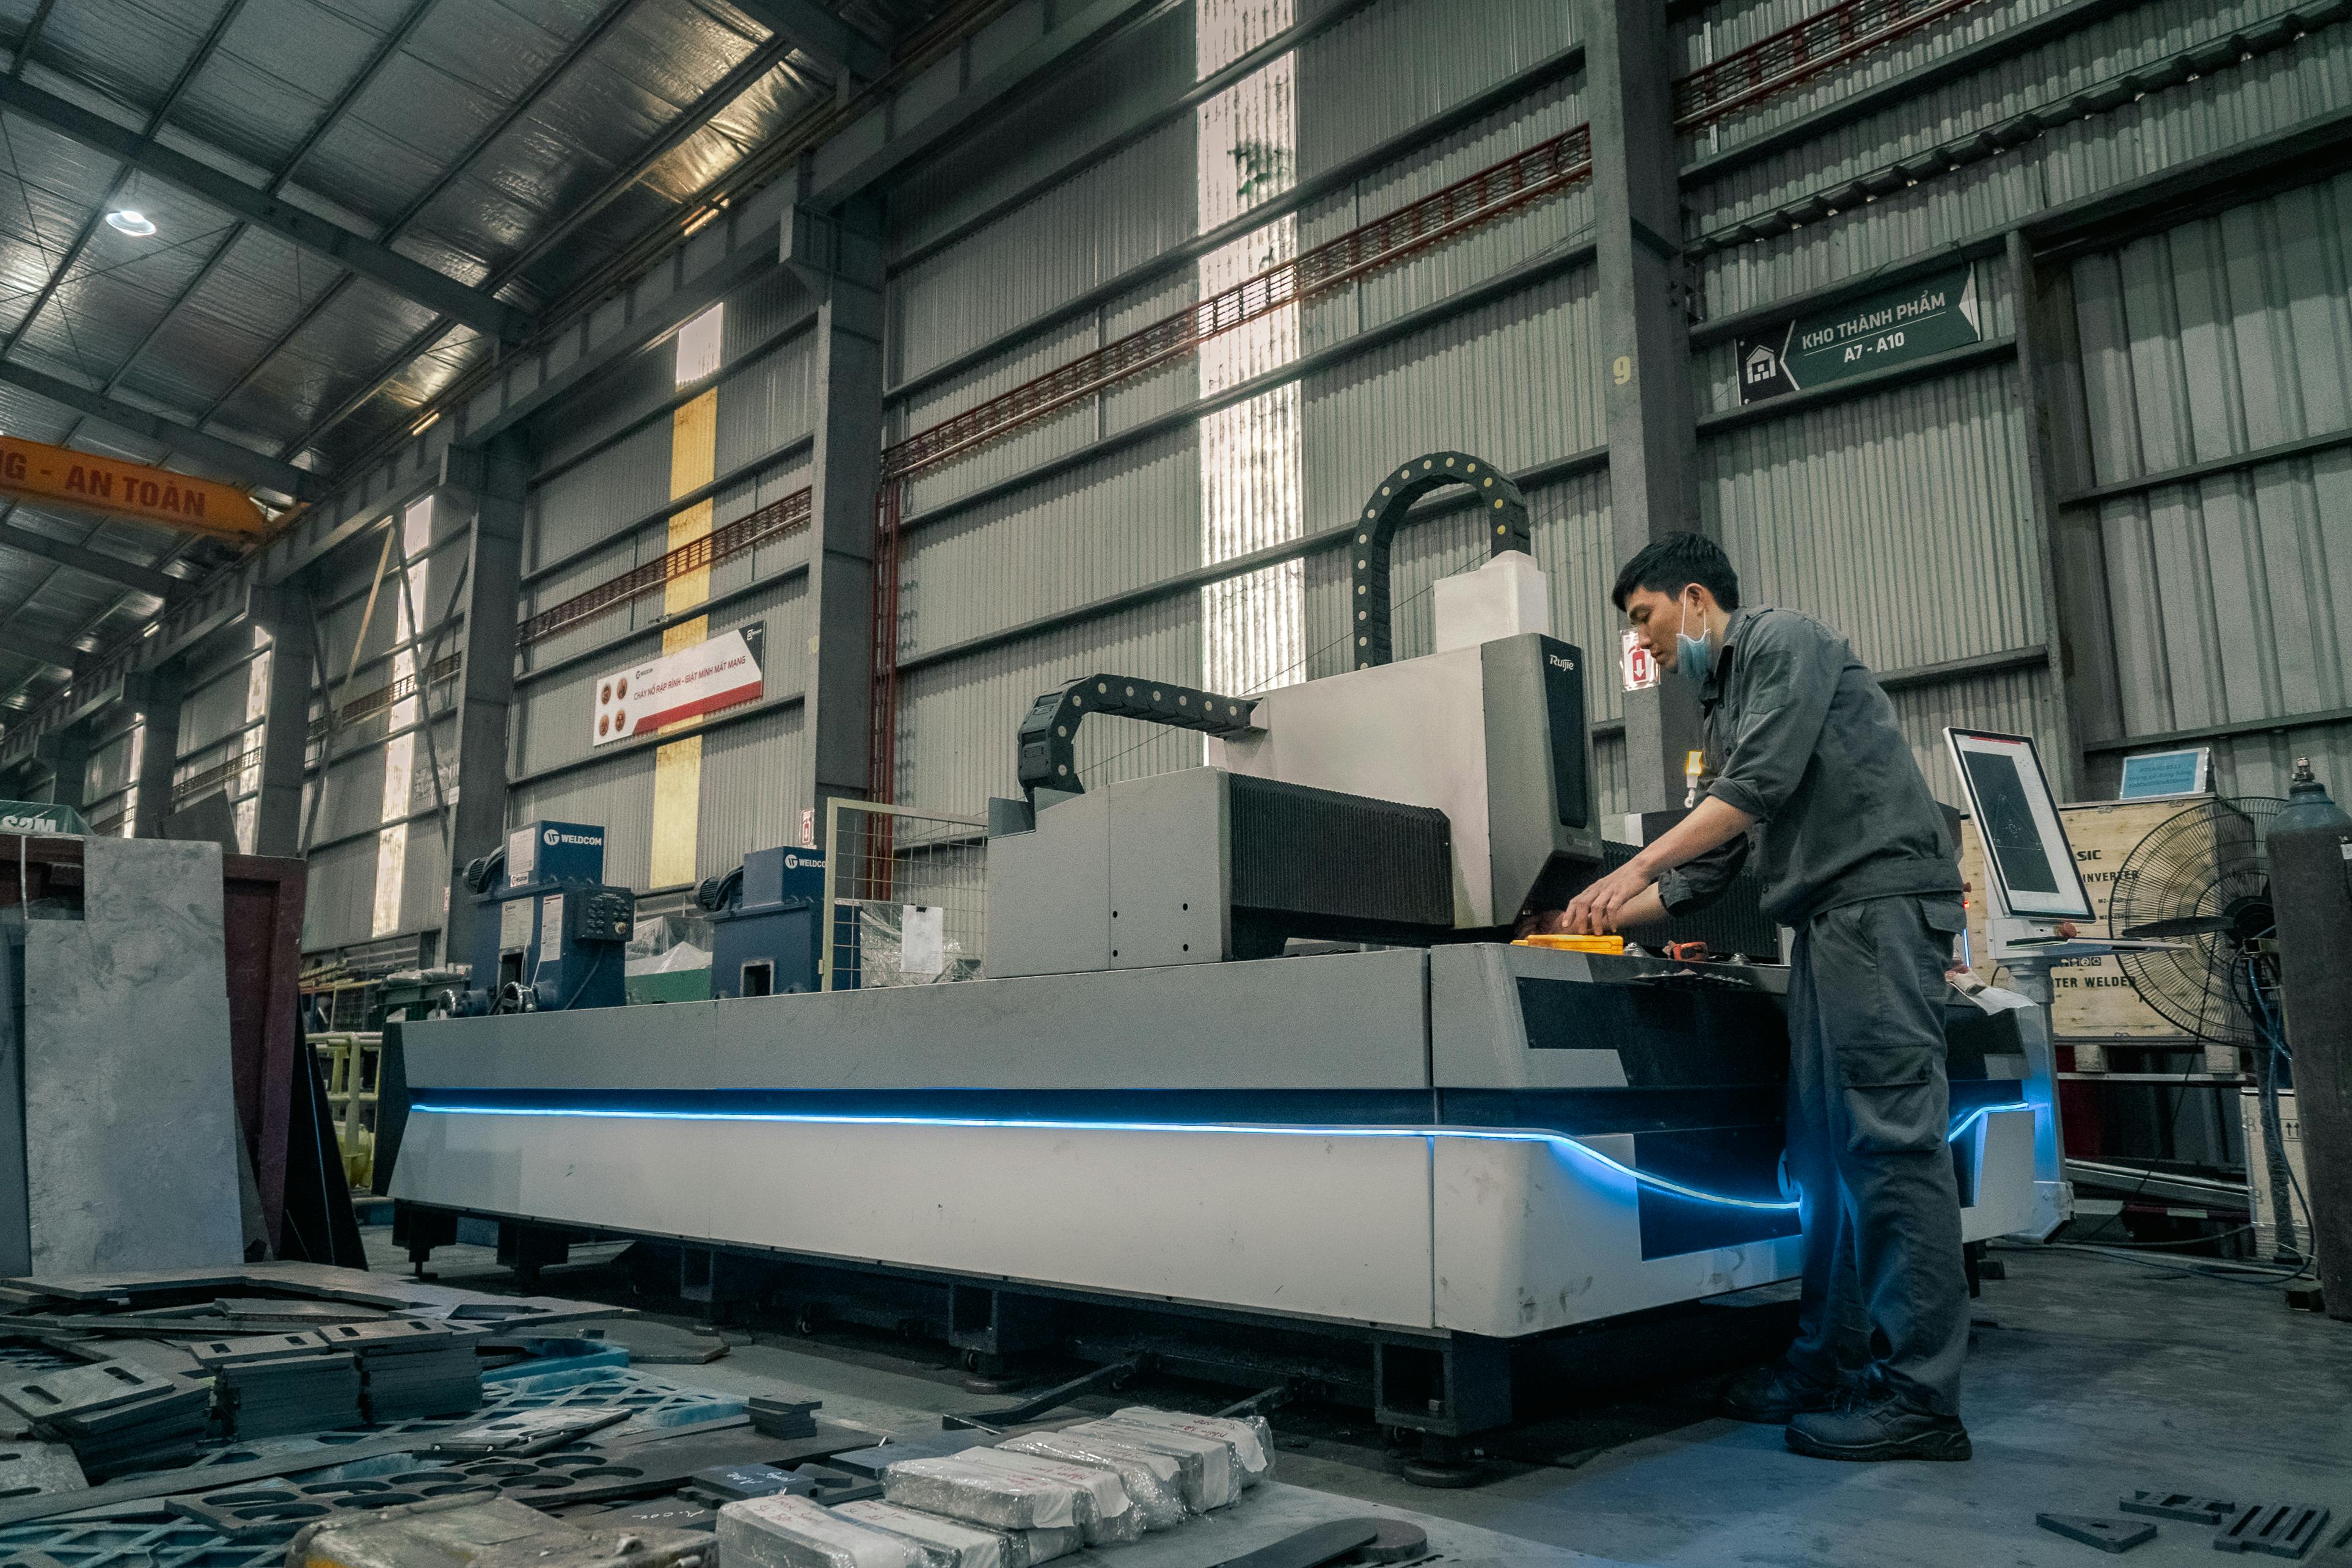
Manufacturing scene - production floor and line Production floor & line
01 / 07
// Capabilities

Built for the production floor, end to end.

From supplier invoices on the way in, to defect alerts on the line, to board-ready production reports on the way out - every stage covered, on the systems your plant already runs.

Downtime tracking Input / output inventory optimisation Lead-time analysis Defect-rate alerts (line / shift / batch) Throughput optimisation Maintenance logs from shift reports Quality benchmarks (defect, scrap, rework) Multi-site inventory visibility Supplier rate cards & rate-card benchmarking Input cost benchmarking Goods-received notes Bills of lading Cross-system reconciliation (ERP · MES · SCADA) Demand forecasting (weather, seasonality) Workforce scheduling & overtime control Plant labour cost analysis Margin clarity (category → SKU) Project / order / shift drill-down Cash flow forecast Board-ready production reporting
02 / 07
Supplier cost ($/unit, neutral grey bars) and margin contribution (% warm line). SUP D's margin drops to 11% - well below the 25% target. Cost & margin 6 SUPPLIERS · $/UNIT · MARGIN % // COST $/UNIT // MARGIN % $120 $80 $40 50% 25% 0% MARGIN TARGET 25% $60 $78 $48 $108 $67 $45 11% SUP A SUP B SUP C SUP D SUP E SUP F ↓ SUP D · 11% MARGIN · -14PP BELOW TARGET · SWITCH RECOMMENDED
// In the wild

Inputs and supply.

Supplier invoices, GRNs, rate cards - ingested, parsed, benchmarked. Drift in input cost flagged before it eats your margin.

  • Cost per supplier benchmarked in real time
  • Margin contribution per supplier, not just $/unit
  • Switch alerts when margin drops below target
  • Daily reconciliation across rate cards, invoices, GRNs
03 / 07
// People & labour

The plant runs on people.

Shift workers, agency cover, contractors and salaried staff - all moving on different rosters and rate cards. Quarri pulls timesheets, invoices and rota systems into one view, so labour cost is always tied back to throughput.

01

Roster & overtime control.

Live shift rosters across sites and lines. Real-time alerts on overtime and agency spend before they eat the margin.

02

Demand-tuned staffing.

Crews matched to shift demand, throughput, and historical yield. Bench time and reactive cover collapsed.

03

Plant labour cost.

Cost per unit broken down by line, shift, and skill mix - reconciled across timesheets, invoices, and the GL.

04

Compliance & training.

Certifications, training expiry, and safety records tracked from paper records. Audit-ready before the auditor arrives.
04 / 07
// Customer impact

Real numbers from real production floors.

$15k+Payment errors caught
$300kAccounting error fixed
100+ hrsManual workflows automated
100M+Data points analysed
500+PDFs & images parsed
$150k+Margin discovered
99%+Scanning accuracy
Manufacturing scene - warehouse and inbound dock Warehouse & inbound dock
05 / 07
Per-product inventory ladder. Component R input (1.2k) is below safety stock - 5 days to stockout, lead time 12d. Inventory by product UNITS · LEAD TIME PRODUCT INPUT & OUTPUT · UNITS LEAD TIME SAFETY 2K CMP R CRITICAL IN OUT 1.2k 4.4k 12d CMP S OK IN OUT 3.8k 2.1k 6d ASM M OK IN OUT 5.4k 3.7k 8d ASM N OK IN OUT 2.1k 5.9k 9d ↓ CMP R · INPUT BELOW SAFETY · 5d TO STOCKOUT · LEAD 12d
// In the wild

Inventory in. Inventory out. Lead time live.

Multi-site inventory visibility. Lead-time analysis by SKU, supplier, season. Forecasts that pull weather, demand, and historical yield together.

  • Per-product input + output across every site
  • Safety-stock alerts before the stockout
  • Lead time per supplier, not buried in the ERP
  • Critical SKUs surfaced; routine ones suppressed
The Quarri integration has made me do more with AI in the past 6 weeks than I have in the past 6 months.
Head of Operations
Forestry & Milling Enterprise · North America
06 / 07
Returns & defects rate by region across the last 4 weeks. US-Midwest week 4 spiked to 4.6% - traced to Line 3 SKU 4421. Returns & defects · 5 regions · 4-week · % W1 W2 W3 W4 US MIDWEST 1.8 2.2 2.4 4.6 US SOUTH 2.1 2.4 2.2 2.6 EU NORTH 1.6 1.8 1.7 2.0 EU SOUTH 1.4 1.5 1.7 1.9 APAC 1.2 1.3 1.5 1.4 LINE 3 SKU 4421 2.4× SPIKE ↑ US-MIDWEST · 2.4× SPIKE W4 · LINE 3 · SKU 4421
// In the wild

Catch the defect. Trace the cost.

Returns and defect rates surfaced by region and week. Spikes traced from the heatmap to the line, the SKU, and the shift - in seconds.

  • Returns + defect rate by region, 4-week trend
  • Pre-attentive heat ramp; spikes pop instantly
  • Drill from a hot cell to line, SKU, and shift
  • Customer/region patterns the ERP alone hides
07 / 07

Live in two weeks.

Bring your own messy data - we'll show you what runs faster on the floor.